


TL;DR:
Using Redshift as a Data Warehouse to integrate data from AWS Pinpoint, AWS DynamoDB, Microsoft Dynamics 365 and other external sources.
Once the data is ingested to Redshift, DbT is used to transform the data into a format that is easier to be consumed by AWS Quicksight.
Each Quicksight report/chart has a fact table. This strategy allows Quicksight to efficiently query the data needed.
The Customer
The client is a health tech startup. They created a mobile app that feeds data to the cloud using a serverless architecture. They have several data sources and would like to integrate this data into a consolidated database (Data Warehouse). This data would then be presented in a reporting tool to help the business drive decisions. The client’s data sources:
- AWS DynamoDB – User preferences
- AWS Pinpoint – Mobile application clickstream
- Microsoft Dynamics 365 – Customer relationship management
- Stripe – Customer payments
- Braze – A customer engagement platform
The client also needs to send data from the Data Warehouse to Braze, used by the marketing team to develop campaigns. This was done by the client, using Hightouch Reverse ETL.
The Solution
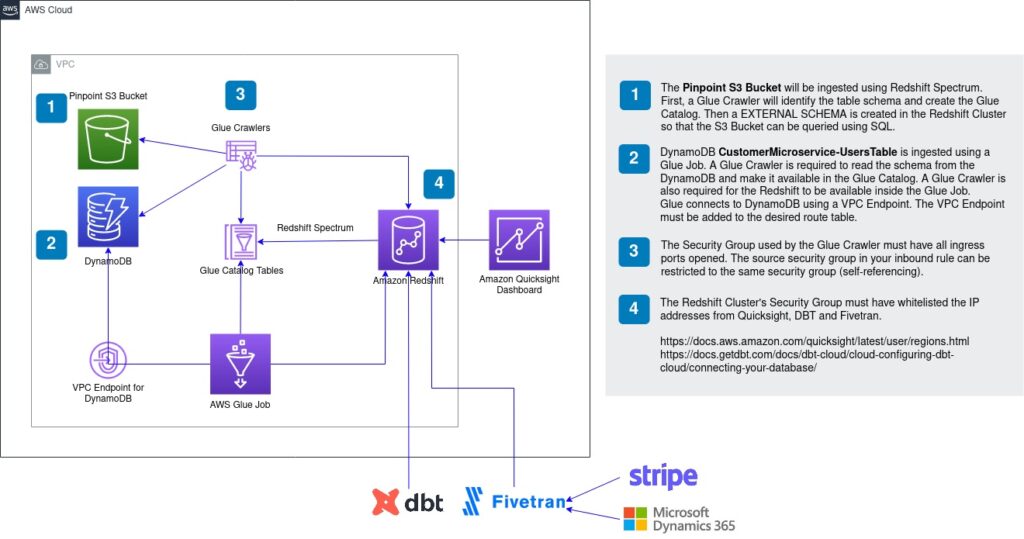
The overall architecture of the solution is presented in Figure 1. AWS Redshift is the Data Warehouse, which receives data from Pinpoint, DynamoDB, Strip and Dynamics 365. Quicksight then queries data from Redshift to produce business reports. Following, we will describe each data source integration. As a Cloud-native company, we work towards allowing our clients to easily manage their cloud infrastructure. For that reason, the infrastructure was provisioned using Terraform. Terraform allowed the client to apply the same network and data infrastructure in their 3 different environments with ease.
DynamoDB
The users’ preferences are stored on AWS DynamoDB. A simple AWS Glue job, created using Glue Studio, is used to send DynamoDB data to Redshift. It was not possible to use the COPY command from Redshift as the client’s DynamoDB contains complex attributes (SET). The job contains a 5-line custom function to flatten the JSON records from DynampoDB, presented in Table 1. For Glue to access DynamoDB tables we needed to create a VPC Endpoint
def MyTransform (glueContext, dfc) -> DynamicFrameCollection:
	df = dfc.select(list(dfc.keys())[0])
	dfc_ret = Relationalize.apply(frame = df, staging_path = "s3://bucket-name/temp", name = "root", transformation_ctx = "dfc_ret")
	df_ret = dfc_ret.select(list(dfc_ret.keys())[0])
	dyf_dropNullfields = DropNullFields.apply(frame = df_ret)
	return(DynamicFrameCollection({"CustomTransform0": dyf_dropNullfields}, glueContext))
Pinpoint
The mobile app clickstream is captured using AWS Pinpoint and stored on S3 using an AWS Kinesis delivery stream. There are many ways to load data from S3 to Redshift. Using COPY command, a Glue Job or Redshift Spectrum. We decided to use Redshift Spectrum as we would need to load the data every day. Using Spectrum we can rely on the S3 partition to filter the files to be loaded. The pinpoint bucket contains partitions for Year, Month, Day and Hour. At each run of our ELT process, we filter S3 load based on the latest date already loaded. The partitions are automatically created using Glue Crawler. Glue Crawler also automatically parse JSON into struct columns types. Table 2 show a SQL query that illustrates the use of Spectrum partitions.
select
  event_type,
  event_timestamp,
  arrival_timestamp,
  attributes.page,
  attributes.title,
  session.session_id as session_id,
  client.cognito_id as cognito_id,
  partition_0::int as year,
  partition_1::int as month,
  partition_2::int as day,
  partition_3::int as hour,
  sysdate as _dbt_created_at
  from pinpoint-analytics.bucket_name

  -- this filter will only be applied on an incremental run
  where
  partition_0::int >= (select date_part('year', max(event_datetime)) from stg_analytics_events)

  and partition_1::int >= (select date_part('month', max(event_datetime)) from stg_analytics_events)

  and partition_2::int >= (select date_part('day', max(event_datetime)) from stg_analytics_events)
Microsoft Dynamics 365 and Stripe
Two important external data sources required in this project are CRM data from Dynamics and Payment information from Stripe. An efficient and user-friendly service that helps with data integration is Fivetran. Fivetran has more connectors than other tools, including Microsoft Dynamics and Stripe. Fivetran provides such a connector and has an easy to use interface which was essential for this client.
DbT – ELT FLow
The client wanted a data transformation tool that was scalable, collaborative and that allowed version control. DbT was our answer. As we have seen in many other clients, DbT has been the first answer when it comes to running ELT (Extract, Load, Transform) workflows. After we built the first DAGs (Directed Acyclic Graph) with DbT, using Jinja template for raw tables (source) and staging table (references) and showed it to the client, they were amazed by the simplicity and software engineering way that DbT works. Having an ELT workflow that is source controlled is a very unique feature from DbT.
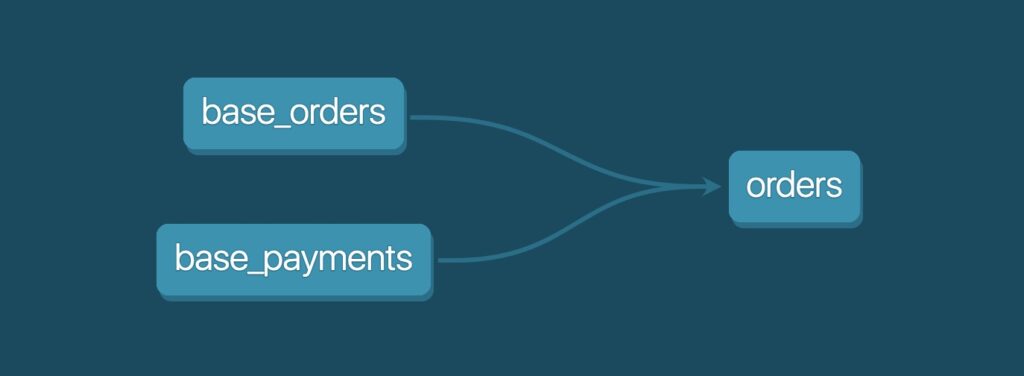
In DbT, the workflow is separated into different SQL files. Each file contains a partial staging transformation of the data until the data is consolidated into a FACT or DIMENSION table. These final tables are formed by one or more staging tables. Using the Jinja templates to reference tables between each other allows DbT to create a visual representation of the relationships. Figure 2 presents an example of a DbT visualization. DbT allowed us to create tables that could be efficiently queried by Quicksight.
Quicksight
Once the data is organised and loaded into Redshift, it is time for visualising it. AWS Quicksight easily integrates with Redshift and several other data sources. It provides a number of chart options and allows the clients to embed their reports in their internal systems. For this client, we use Bar charts, Pie charts, Line charts and a Sankey diagram for customer segment flow. The client was very happy with the look and feel of the visualizations and with the loading speed. Some minor limitations from Quicksight include a) not being able to give a title to multiple Y-axis and b) making the Sankey diagram follow the dashboard theme. Except that, it allowed us to reach a great improvement in the client’s ability for data-driven decision making.
A great next step regarding the Quicksight would be to implement QuickSight object migration and version control from staging to production environments.
Conclusion
In this article, we described a simple and efficient architecture that enabled our client to obtain useful insights from their data. Redshift was used as the central repository of data, the Data Warehouse, receiving ingestion from several data sources such as Pinpoint, DynamoDB, Dynamics and Stripe. DbT was used for the ELT workflow and Quicksight for the dashboard visualisations. We expect to be using this same architecture for clients to come as it provides agile data flows and insightful dashboards.
At DNX Solutions, we work to bring a better cloud and application experience for digital-native companies in Australia.
Our current focus areas are AWS, Well-Architected Solutions, Containers, ECS, Kubernetes, Continuous Integration/Continuous Delivery and Service Mesh.
We are always hiring cloud engineers for our Sydney office, focusing on cloud-native concepts.
Check our open-source projects at https://github.com/DNXLabs and follow us on Twitter, Linkedin or Facebook.