As a cloud consulting company, we at DNX work directly with many Fintechs and SaaS companies using AWS.
Many of these companies need to meet high levels of compliance providing their software in a single-tenant architecture, where each of their customers has their own AWS account to guarantee full isolation between customers.
This raises a challenge for managing and monitoring these individual accounts, which can reach the hundreds.
The Business Challenge
The challenge is to build a centralised observability solution that would aggregate metrics, logs, and alarms (known as the three pillars of observability) with the data flowing privately within AWS.
In this example, we will consider a client where each tenant is using a stack with ECS Fargate with AppMesh and wishes to centralise the observability of these stacks in a cost-effective way.
Objectives
The SaaS Observability proposal includes the following main objectives:
Reduced Operation hours (having a centralised panel across all customers)
Reduced Cost (having a observability backend stored in a centralised account)
Quick response to alarms (automation to trigger alarms based on metrics across customers)
Plugable (ability to add the observability strategy in the current stack)
The Solution
We started breaking the problem into 3 parts.
Tracing
We decided to try Jaeger, which is an open source, end-to-end distributed tracing. All we needed was to deploy a sidecar container with Jaeger running along with AppMesh envoy and configured 3 parameters for Envoy container configuration to send the tracing data to Jaeger. This works out of the box.
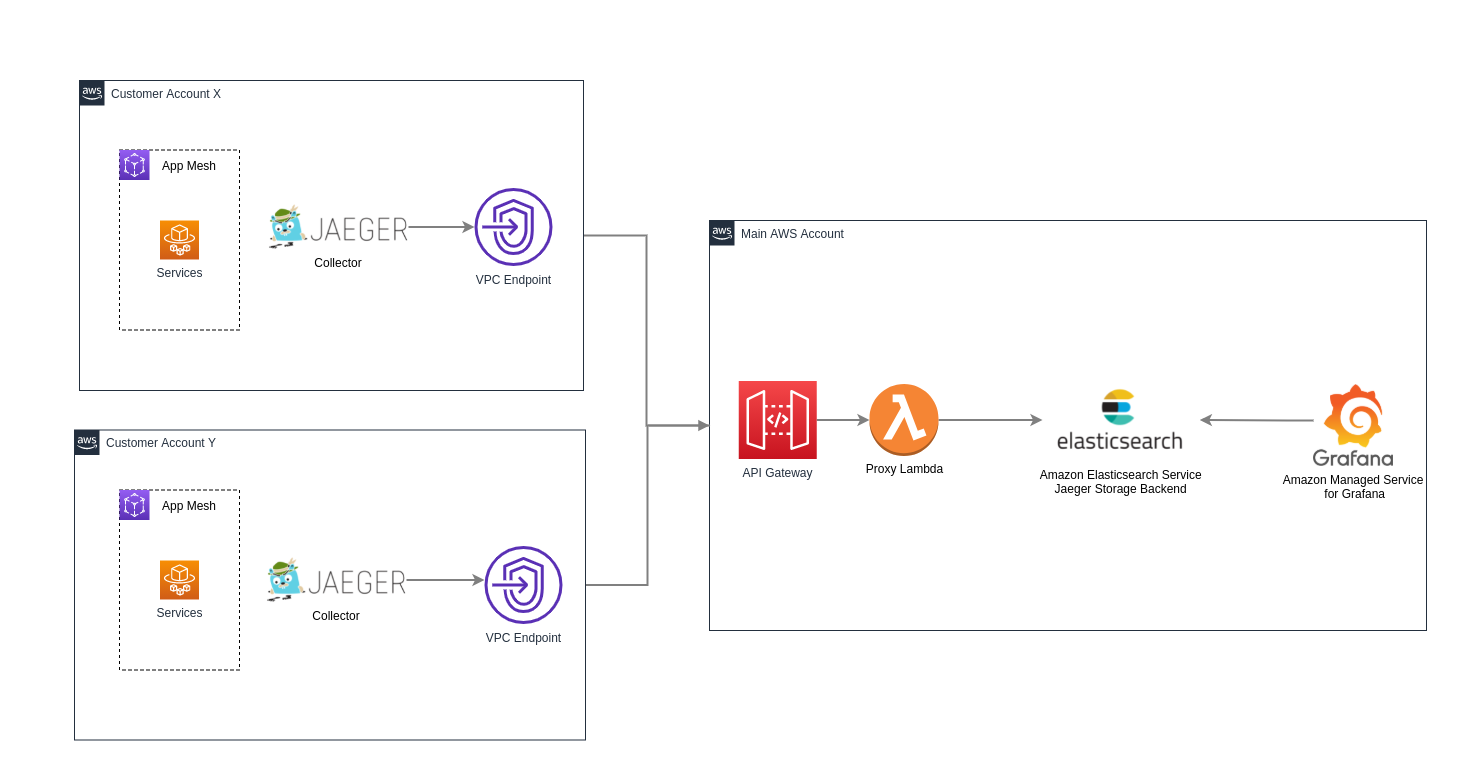
But another problem was coming; Jaeger supports different storage backends including memory, Cassandra, Elasticsearch, Kafka, and more. The recommended backend is Elasticsearch and we were also always looking to use the most managed services from AWS. Meaning that an Amazon Elasticsearch Service cluster should be deployed in the main account to store all tracing data from each tenant, but because we are trying to send requests between two different accounts, we ended up with a question; how do we make this link happen, given that there is no VPC endpoint support for ES into two accounts?
The answer was to create a proxy using a private API Gateway and a Lambda on the border of the main account. The lambda will take the request coming from Jaeger and just proxy to Elaticsearch adding AWS credentials headers to the request. On the tenant account we configured a VPC Endpoint to this API Gateway and limited access to specific VPCs (only tenant VPC can make requests to API Gateway).
Moving to the metrics we decided to go with AWS Distro for OpenTelemetry Collector (AWS OTel Collector), which is an AWS supported version of the upstream OpenTelemetry Collector and is distributed by Amazon. It supports the selected components from the OpenTelemetry community. It is fully compatible with AWS computing platforms including EC2, ECS, and EKS. It enables users to send telemetry data to Amazon Managed Service for Prometheus as well as the other supported backends.
Metrics
Like we did with Jaeger, we deployed aws-otel-collector as a sidecar container along with ECS services. The configuration was stored inside a SSM parameter folling the documentation https://aws-otel.github.io/docs/setup/ecs/config-through-ssm.
aws-otel-collector configuration
Usually a basic configuration is required to set up receivers, processors, service, and exporters.
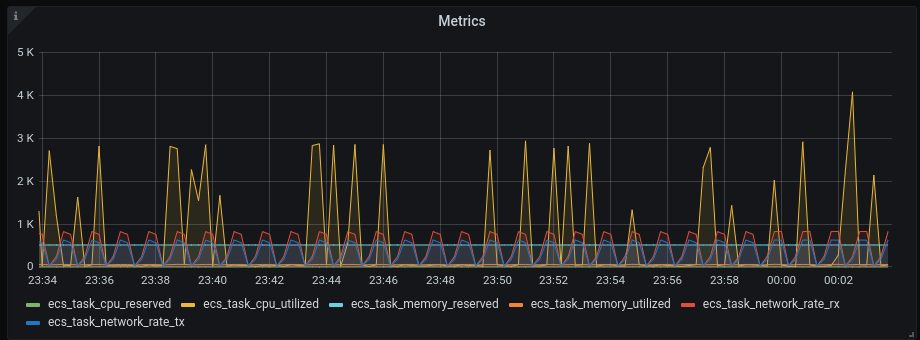
For receivers, we used awsecscontainermetrics (memory, network, storage and CPU usage metrics), otlp, and statsd. Remember to open ports on the container definition or otherwise services will not be able to send metrics to the collector.
Notice that the role_arn we are pointing to a role on the main account, and when aws-otel-collector starts, it will assume the role that gives permissions to remote write to the Amazon Managed Prometheus. To do that, we need to:
Assume role permissions to the trust relationship for the Task Role to the tenant ecs.
Once the otel-collector and jaeger were running, the last step was to deploy and set up Amazon Managed Service for Grafana inside the main account.
The deployment is simple but requires AWS SSO configured in the root account.
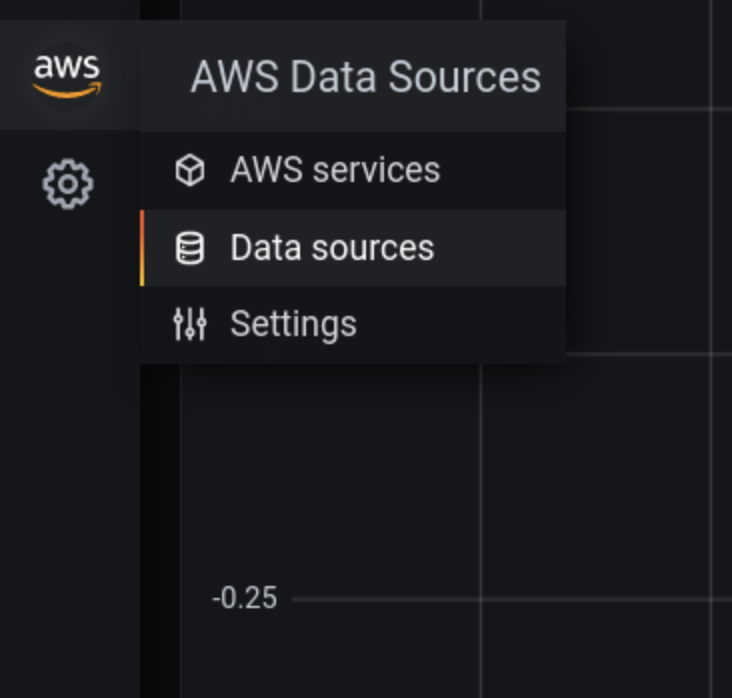
To setup you can go to:
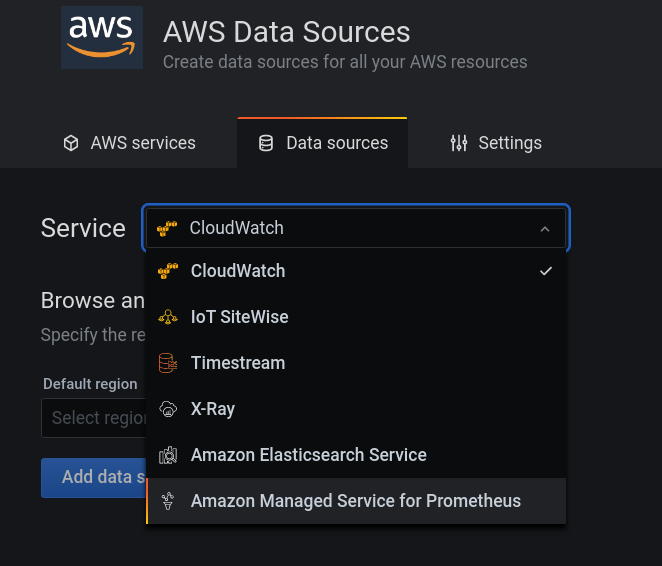
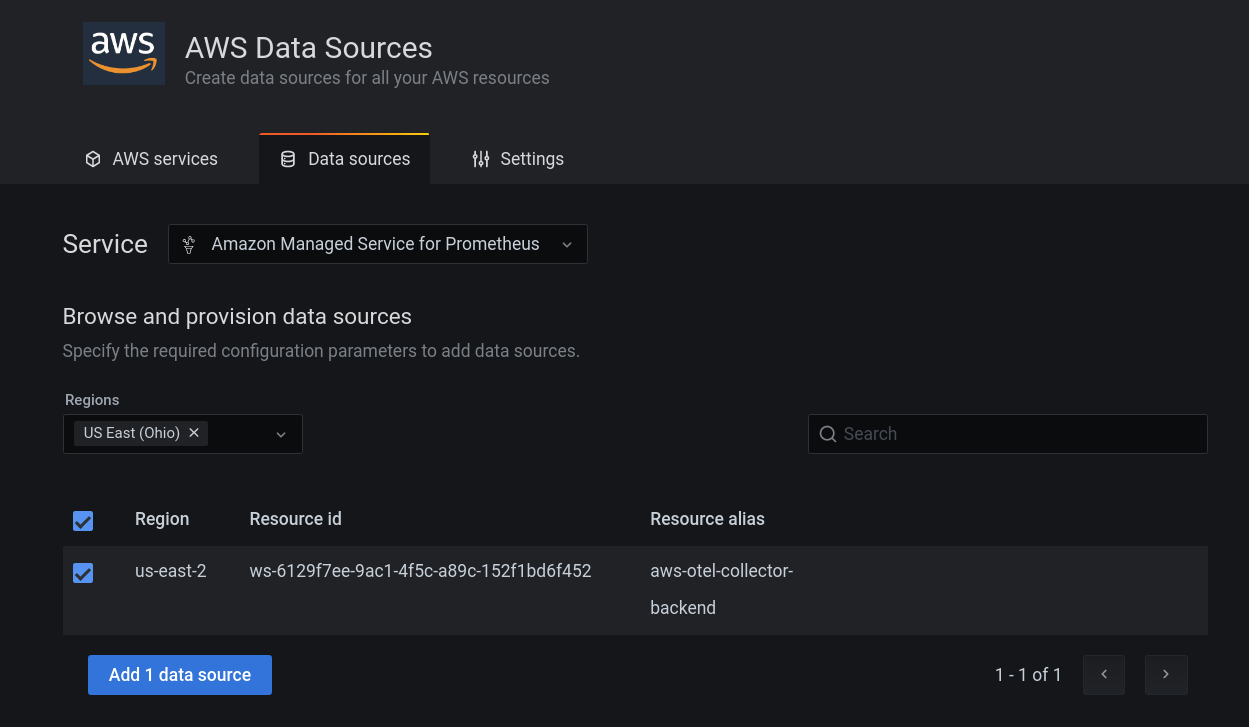
AWS DataSources
Amazon Manager Service for Prometheus
Select region and click Add data source Then the visualisation we have in the dashboard is:
Conclusion
With the new observability stack built by DNX, they can now achieve a centralised storage and dashboard for metrics, tracing, and logs in an elastic and highly available way on AWS. The uncoupled solution enables hybrid configurations. This can accelerate development by finding improvements and bugs with alarms. We calculate that this architecture would bring a considerable cost reduction, reducing the usage of CloudWatch and XRay up to 70%!
Well, this is the magic that the CDK provides us. As there is a library behind all the methods and functions, it sees all the dependencies and automatically creates the missing resources for us, connecting them so that everything has a connection with as little access as possible, leaving what is necessary for the correct function between the resources. For example, the instance’s Security Group. As we marked that the EC2 instance listens on port 80, only port 80 will be added to the Security Group as an ingress value.
At DNX Solutions, we work to bring a better cloud and application experience for digital-native companies in Australia.
Ready to align your technology with your business growth strategy? Talk to DNX about modernising your platform for scalability, resilience, and faster time-to-market.


 Moving to the metrics we decided to go with AWS Distro for OpenTelemetry Collector (AWS OTel Collector), which is an AWS supported version of the upstream OpenTelemetry Collector and is distributed by Amazon. It supports the selected components from the OpenTelemetry community. It is fully compatible with AWS computing platforms including EC2, ECS, and EKS. It enables users to send telemetry data to Amazon Managed Service for Prometheus as well as the other supported backends.