


")
In the modern cloud era, observability is not optional — it is mission-critical. For billing platforms in the utility sector, it is even more critical: reliability, accuracy, and transparency are not just operational goals but regulatory requirements.
The Business Context
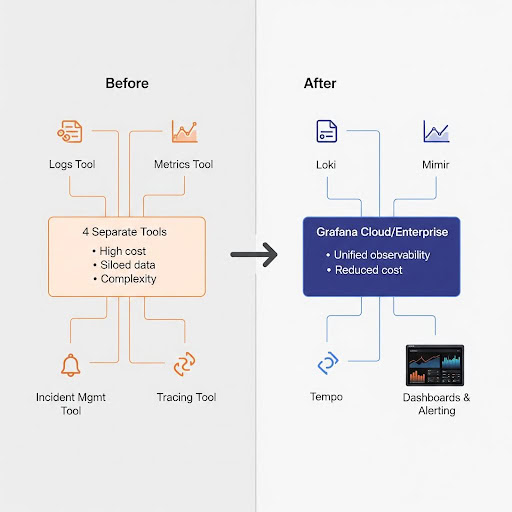
When our client, a global provider of SaaS solutions for utilities, inherited its billing platform post-acquisition, the observability landscape was fragmented across four different tools — one for logging, another for metrics, another for tracing, and another for incident management. This fragmentation created complexity, increased costs, and slowed down the ability to troubleshoot issues that could directly affect billing operations.
Equally important, any observability solution needed to meet strict data residency requirements. With data residency available in Australia, Grafana Cloud / Enterprise was uniquely positioned to support our client’s compliance goals.
Working closely with Grafana as the technology partner, DNX led the delivery of a unified observability solution. By consolidating multiple tools into Grafana Cloud / Enterprise, our client gained a single source of truth — reducing vendor sprawl, improving reliability, and ensuring its billing platform could meet the demands of a highly regulated industry.
Challenge
For a platform as critical as billing, tool sprawl presented serious challenges:
Fragmented Visibility: With different tools for logs, metrics, tracing, and incidents, teams had to switch contexts, slowing down resolution.
Rising Costs: Maintaining multiple vendor contracts added financial overhead.
Operational Risk: Fragmentation made it harder to quickly detect anomalies, potentially impacting billing accuracy and compliance.
The Solution: Grafana Cloud / Enterprise
DNX and Grafana worked hand in hand to design and deliver a consolidated observability platform:
Data Residency in Australia: Grafana provides data residency in Australia, an essential capability for the client to meet compliance and regulatory obligations in the utility sector.
Unified Toolkit: Grafana Cloud / Enterprise brought together dashboards, Loki (logging), Tempo (tracing), Mimir (metrics), and alerting into a single platform.
Consolidation of Four Tools into One: Complexity was reduced as multiple disconnected tools were replaced by Grafana’s comprehensive stack.
Joint Delivery: DNX acted as delivery lead, integrating Grafana into the client’s AWS environments. Grafana provided training, environment sizing, and best practices to ensure long-term success.
Fit for Regulation: Consolidated observability created easier auditability and compliance visibility for billing operations.
The Results
The impact was clear and measurable:
Unified Observability: One platform for logs, metrics, tracing, and alerts.
Reduced Vendor Sprawl: Lower costs and simpler operations.
Faster Troubleshooting: Teams could identify and resolve billing-impacting issues faster.
Smoother Cutovers: During the production migration, Grafana provided real-time visibility into integration values and system health.
Compliance Ready: With Australian data residency and consolidated observability, the client now has greater transparency and audit readiness — meeting the strict requirements of the utility sector.
The Partnership
The success of the project was built on strong collaboration:
- DNX led delivery, aligning observability with the broader migration strategy.
- DNX and Grafana actively engaged with the client’s team, running multiple training sessions, conducting environment sizing workshops, and sharing best practices to accelerate adoption.
- Together, DNX and Grafana created a future-ready observability model tailored to the needs of a regulated billing platform.
This collaboration also marked a milestone: This is the client’s first AWS Marketplace deal delivered in partnership with DNX and Grafana — a model for how technology partnerships can create lasting value.
Next Steps
This integration is only the beginning of the client’s observability journey. With Grafana as the centralised platform, they will gradually consolidate all products and environments into a single observability tool.
The vision is clear:
- One platform, company-wide — replacing fragmented monitoring across business units.
- Consistent governance — unified dashboards and alerts aligned to regulatory standards.
- Scalability — an observability strategy ready to support their growth and future acquisitions.
By positioning Grafana at the heart of its observability strategy, the company is building more than a monitoring solution — it’s creating a central nervous system for the business.
Conclusion
For billing platforms in the utility sector, observability is more than a technical requirement — it’s a business-critical capability. By consolidating four tools into one, DNX and Grafana supported the company to simplify operations, reduce costs, and improve both reliability and compliance visibility.
With DNX as delivery lead and Grafana as technology partner, the client now operates with confidence in its ability to monitor, troubleshoot, and grow its billing platform. And with Grafana becoming the centralised observability platform across all of the client’s products, the company is set to achieve even greater visibility, consistency, and resilience in the years ahead.
Build Confidence in Every Migration
Whether you’re consolidating tools, improving observability, or planning a complex migration, DNX helps enterprises move with confidence. Connect with our modernisation specialists to explore how your organisation can achieve secure, compliant, and disruption-free transformation.